Site Tools
User Tools
This is an old revision of the document!
Visualization
The different tools allowing you to explore your project in the visualization window are stored in the View menu, it regroups the following elements:
- Previous zoom (<): go back to the previous displayed scale, available only if you have once changed the scale
- Zoom by rectangle (Z): This tool uses a click-release action, click on the left button of the mouse and drag it, it makes a rectangular ghost. The zoom factor is inversely proportional to the size of the rectangle. The type of zoom is determined by the direction of the drag:
- Left to right: zoom in
- Right to left: zoom out
- Pan (H): Move the map with a drag and drop action
- Zoom to full extend (Ctrl+0): Adjust the scale to display all the activated layers
- zoom to layer: Adjust the scale to display the whole selected layer
- Refresh (Ctrl+R): Refresh the screen
Symbology
The symbology windows allow you to manage the style of each layer. You have several options available depending of the layer style. They are accessible by double clicking on the layer name in the table of content or with the option Symbology… of the contextual menu.
Points
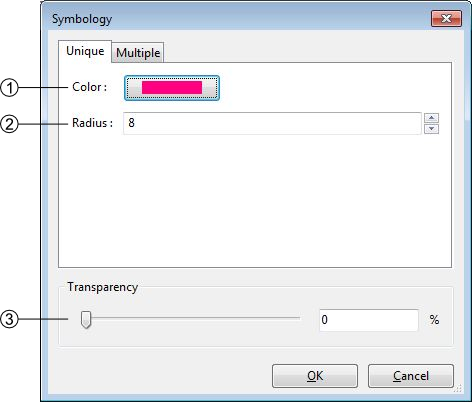
- Points style management: you can change the color and the radius of the points
- Transparency management
- Apply or cancel the modifications
The points have an additional option found on the other tab of the window (multiple). Under this tab you are able to attribute two different symbology to your lines. The differenciation of the points is made through the queries.
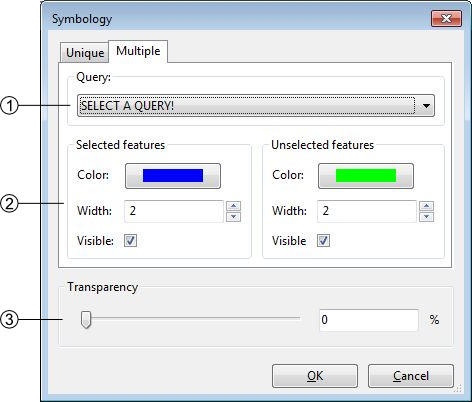
- Query selected for the differenciation
- symbology management of the two classes
- transparency management
The symbology is directly connected to the attribution of the point, changing its attributes may instantly change its symbology. This option can be very helpfull to highlight specific classes.
Lines
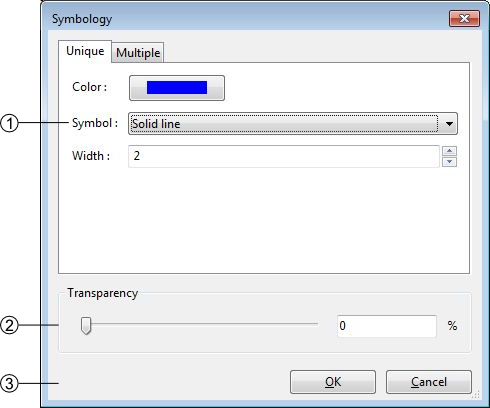
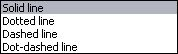
- Lines style management, you can change the color the width and the symbol of the lines. There are four choices of shape
- Transparency management
- Apply or cancel the modifications
The lines have an additional option found on the other tab of the window (multiple). Under this tab you are able to attribute two different symbology to your lines. The differenciation of the lines is made through the queries.
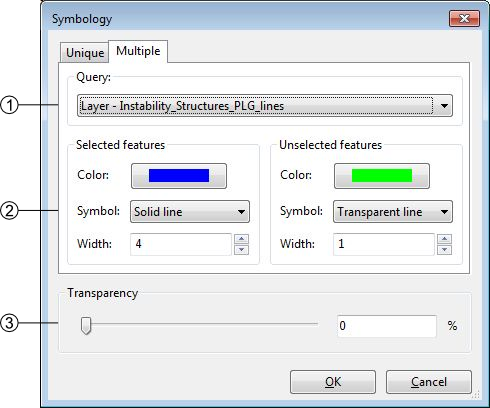
- Query selected for the differenciation
- symbology management of the two classes
in this case the selected features are all the lines with the “Bedrock_PLG” attribution - transparency management
The symbology is directly connected to the attribution of the line, changing its attributes may instantly change its symbology. This option can be very helpfull to highlight specific structures.
Polygons
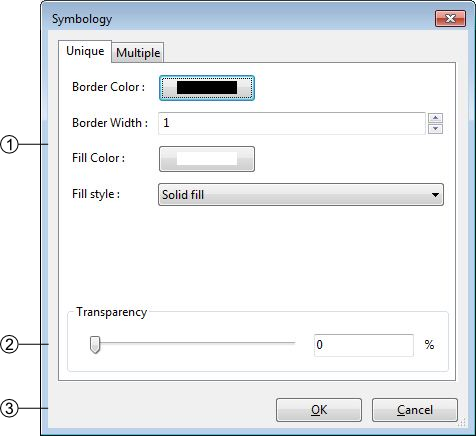
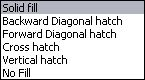
- Polygons style management: you can change the border width and color as the fill color and style. There are few Styles available
- Transparency management
- Apply or cancel the modifications
If your imported polygons have attributes, you can class them to have a multiple symbology. (se also …)
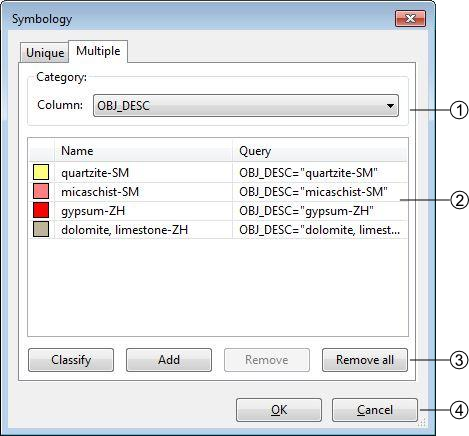
- list of attributes
- list of classes related to the attrib
Images
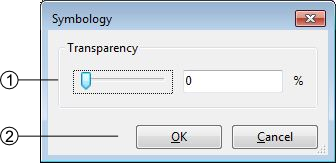
- Transparency management
- Apply or cancel the modifications