Site Tools
User Tools
This is an old revision of the document!
Table of Contents
Functionalities
In ToolMap you have several windows providing you some extra tools or informations. They are discribed underneath.
Information window
The information window is accessible with the menu window → information window. When selecting one or several features, it allows you to display the attributes of each selected feature.
Feature tab
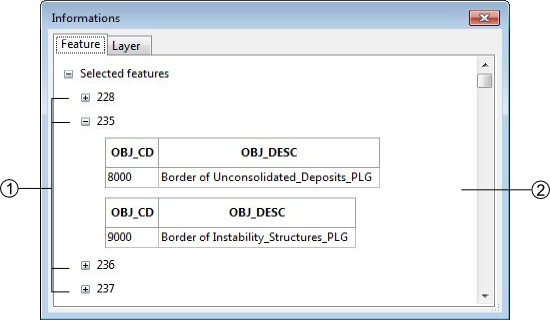
- Selected feature ID
- Features type and attributes
By right-clicking on a feature ID you can access to a contextual menu with the following operations:
- Move to: center the screen on the selected feature
- Zoom to: adjust the scale to display the selected feature on the whole screen. (this option does not work for the point type layers)
- Remove from selection: remove a feature from your selection
- Select this feature only: unselect all the other features in your selection
- Copy data to clipboard: copy the informations of the selected feature
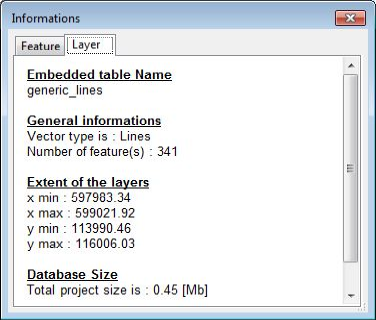
Layer tab
The Layer tab of the Information window displays all the informations on the layer in edition (Layer of the selected features).
Layouts
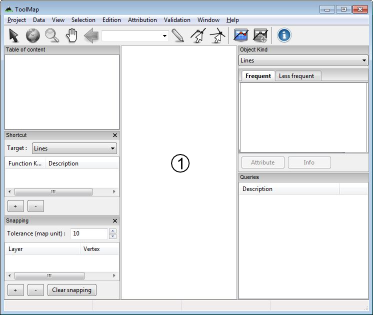
You can access Toolmap's different layouts using the Layout option of the Window menu. These allows you to use three different kinds of windows disposition :
- The Default layout, which is the one you get when first launching Toolmap. This is the one displayed in the User Interface Overview.
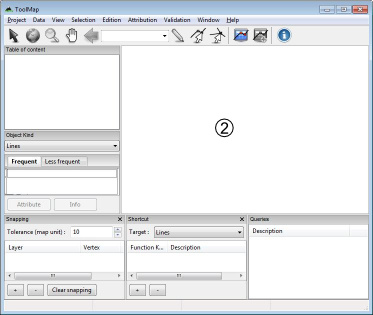
- The Vertical layout, which includes all the useful windows in a vertical display.
- The Horizontal layout, which includes the same windows than the Vertical layout but do so in the left border and the bottom of the display window.
You can freely close any of the tab you wish using the corresponding menu or reorganise your tabs by clicking and droping them where you want them to be. ToolMap will then remember your new custom layout and display it when you launch it.
You can switch back to one of the three base layouts anytime by simply selecting them again in the Window menu.
Statistics
The statistics window is accessible with the option Statistics… of the menu Tools. It allows you wen lauched to count some of your actions in the editing process.
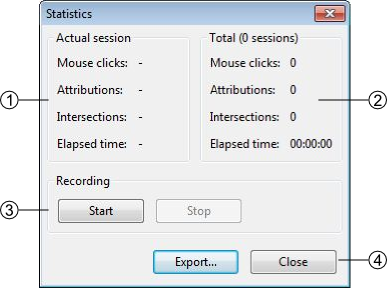
- Statistics of the current session, it displays the number of click made in the visualization window, the number of attribution and intersection you made (i.e. the number of time you used the function intersection or attribution, if you attribute five objects at once it is concidered as one)
- The sum of all the statistics you made on this project
- Statistics management: allow you to start or stop a statistic session. Clicking on start or stop immediately close the window.
- The export option isn't available yet.